
Monthly temperature and precipitation
Monthly temperature and precipitation values come either from interpolations of observed data for current climate conditions or from downscaled global climate model (GCM) data from CMIP5 (IPPC Fifth Assessment) for future and past climate conditions. Monthly temperature and precipitation values are used to generate all the other bioclimatic variables.
| Monthly variable | Description |
|---|---|
| tmin1-12 | Monthly minimum temperature (°C x 10) |
| tmax1-12 | Monthly maximum temperature (°C x 10) |
| prec1-12 | Monthly total precipitation (mm.month-1) |
Bioclimatic variables
Bioclimatic variables are derived from the monthly temperature and precipitation values in order to generate more biologically meaningful variables. These are often used in ecological niche modeling (e.g., Biomod2, MaxEnt, hSDM). The bioclimatic variables represent annual trends (e.g., mean annual temperature, annual precipitation), seasonality (e.g., annual range in temperature and precipitation) and extreme or limiting environmental factors (e.g., temperature of the coldest and warmest month, and precipitation of the wet and dry quarters). A quarter is a period of three months (1/4 of the year).
They are coded as follows:
| Bioclimatic variable | description |
|---|---|
| bio1 | Annual mean temperature |
| bio2 | Mean diurnal range (mean of monthly (max temp - min temp)) |
| bio3 | Isothermality (BIO2/BIO7) (x 100) |
| bio4 | Temperature seasonality (standard deviation x 100) |
| bio5 | Max temperature of warmest month |
| bio6 | Min temperature of coldest month |
| bio7 | Temperature annual range (BIO5-BIO6) |
| bio8 | Mean temperature of wettest quarter |
| bio9 | Mean temperature of driest quarter |
| bio10 | Mean temperature of warmest quarter |
| bio11 | Mean temperature of coldest quarter |
| bio12 | Annual precipitation |
| bio13 | Precipitation of wettest month |
| bio14 | Precipitation of driest month |
| bio15 | Precipitation seasonality (coefficient of variation) |
| bio16 | Precipitation of wettest quarter |
| bio17 | Precipitation of driest quarter |
| bio18 | Precipitation of warmest quarter |
| bio19 | Precipitation of coldest quarter |
This scheme follows that of ANUCLIM, except that for temperature seasonality the standard deviation was used because a coefficient of variation does not make sense with temperatures between -1 and 1).
The 'biovars' method in the R package dismo was used to generate these layers.
Potential evapotranspiration
Potential evaporation or potential evapotranspiration (PET) is defined as the amount of evaporation that would occur if a sufficient water source were available. If the actual evapotranspiration (AET) is considered the net result of atmospheric demand for moisture from a surface and the ability of the surface to supply moisture, then PET is a measure of the demand side. Surface and air temperatures, insolation, and wind all affect this. A dryland is a place where annual potential evaporation exceeds annual precipitation.
We used the Thornthwaite equation (Thornthwaite, 1948) to compute the monthly potential evapotranspiration (pet1-12). The Thornthwaite equation requires only the monthly mean temperature and the monthly mean duration of the day light to compute the PET:
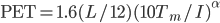 , where:
 : estimated potential evaporation (cm.month-1)
 : mean temperature of the month (°C)
 : average day length of the month (hours)
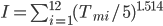 : heat index which depends on the 12 monthly mean temperatures
  (in °C).
Duration of the day light is computed to a day at the midpoint of each month from latitude. The Thornthwaite equation is a simple and robust method to compute the PET when atmospheric conditions (relative humidity, wind speed) are not available. The equation can be used to compute the PET from monthly mean temperatures obtained from global climate model (GCM) data in the future and in the past.
| Bioclimatic variable | Description |
|---|---|
| pet1-12 | Monthly potential evapotranspiration from the Thornthwaite equation (mm.month-1) |
| pet | Annual potential evapotranspiration from the Thornthwaite equation (mm) |
The 'daylength()' function in the R package insol was used to compute the day length for a given date and latitude.
Climatic water deficit and number of dry months
We assumed a climatic water deficit for a given period if precipitation was inferior to the potential evapotranspiration. We then computed the annual climatic water deficit ( ) from monthly precipitation (
 ) and potential evapotranspiration (
 ) as follows:
  .
.
The number of dry months (ndw) is the number of months in the year for which precipitation is inferior to the potential evapotranspiration.
| Bioclimatic variable | Description |
|---|---|
| cwd | Annual climatic water deficit (mm) |
| ndm | Number of dry months in the year |